
PMT webapp
See the things you chose to know.
The PingMyThing webapp is the normal human-facing surface for selected PMT results.
A backup outcome. A job result. An application state. A remote reading. A result that should have arrived again but did not.
The source decides the answer. PMT preserves it. The webapp makes the selected result easier to see.
No endpoint agent. No inventory layer. No remote access. No control plane.
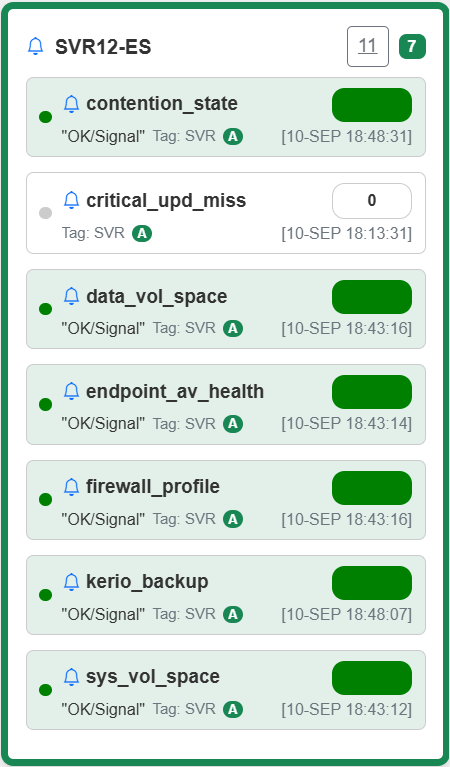
The webapp shows selected received results.
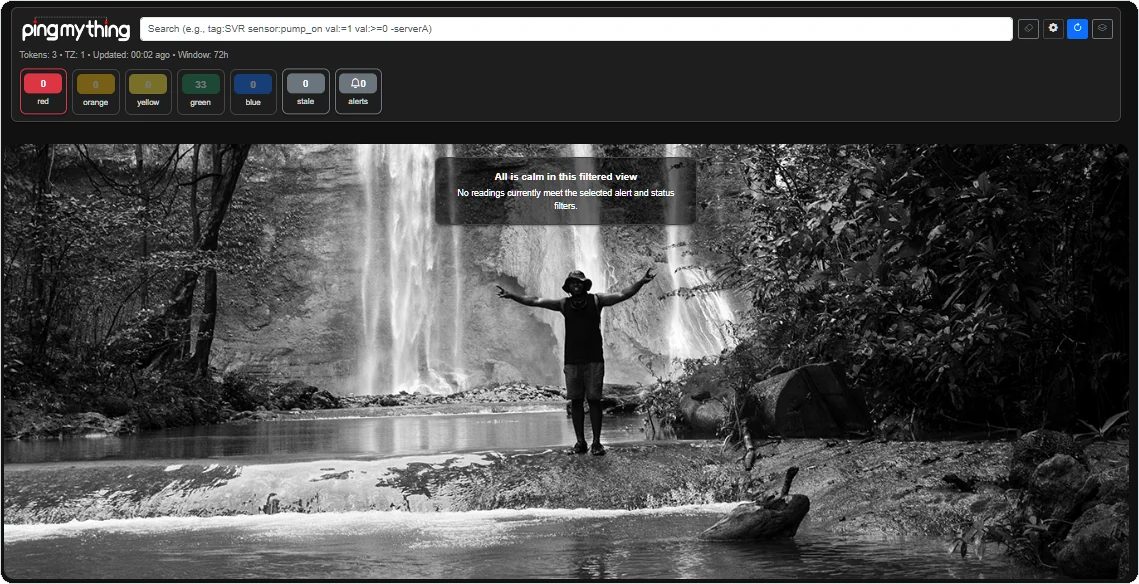
When everything you selected is normal, the screen should look calm.
The webapp is not trying to reward continuous attention.
Normal selected states can stay visually quiet while configured attention, critical, stale or unknown conditions stand out.
Calm means no configured attention state is currently being shown. It does not mean PMT has proved that everything is healthy.
Presentation is not truth.
PMT stores the submitted result. The webapp can then apply local presentation and evaluation rules so that result is useful to a person.
A numeric value can remain numeric or be mapped into an explicit display state. A regular result can become stale under an active cadence rule. Debounce can reduce brief state changes.
Those rules change how the result is evaluated or shown in the webapp. They do not rewrite what the source submitted.
What a result card can tell you
- latest received value
- station and check identity
- last received time
- configured display state
- stale expected reporting
- recent history
The source owns the meaning. The operator owns the interpretation.
Make expected reporting visible.
Automatic cadence is learned in the browser from six distinct reading timestamps using the median interval. Once confirmed, the default late/no-signal thresholds derive from approximately 2× and 6× that interval.
Explicit fade/stale rules and per-signal auto-staleness overrides can change how a signal is presented.
A stale state says an expected result did not arrive under the active browser rule. It does not diagnose why.
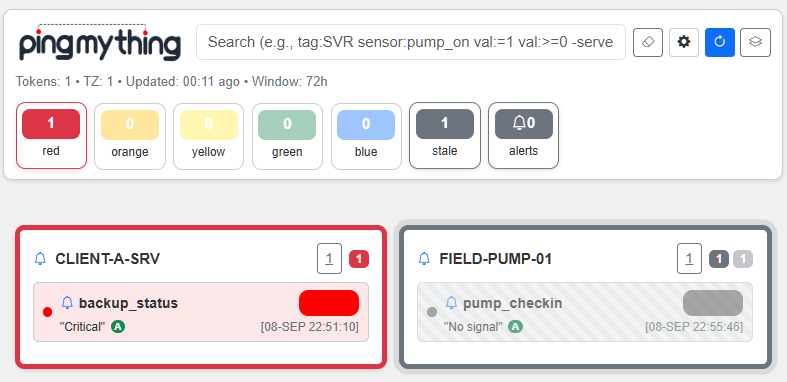
Stale state is based on the active learned or configured cadence, not a diagnosis of the source system. Failure is reported from the source.
Useful defaults, with control where it matters.
Advanced presentation can define display names, value ranges/states, debounce/cooldown, explicit fade/stale rules and per-signal auto-staleness behaviour.
Sensor configuration can be exported and imported as JSON. Full dashboard JSON exports are different: they contain full read tokens but not the runtime access PIN, so treat them as credential-bearing files.
Local preferences, sensor overrides, learned cadence and favourites are browser-local rather than a server-synchronised dashboard configuration.
The settings change browser evaluation and presentation. They do not rewrite the stored PMT result.
Separate at source. Combine selected views where useful.
Keep customers, sites, branches, equipment groups or research projects separated using project-scoped access.
Where access has been granted, selected read tokens can be viewed together in the webapp for one operational view.
Combining the view does not merge the projects or expand the token scope.
Read about project separation →
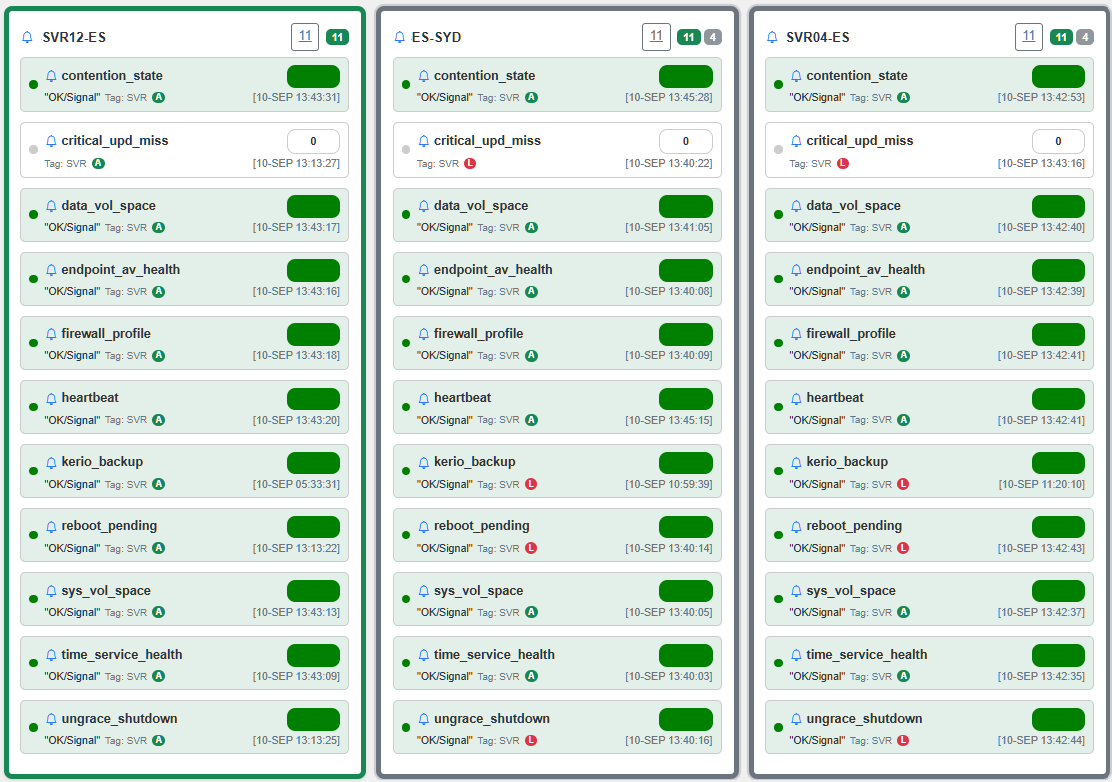
Projects remain separated at source.
Inspect recent results without inventing a story.
Open a station and check to inspect recent stored values and timestamps.
History helps with reference and follow-up. It does not imply diagnosis, causality or complete understanding of the source system.
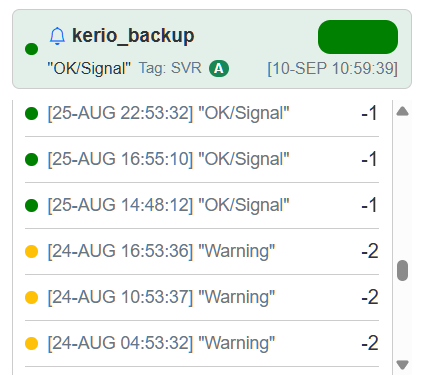
Interpretation remains with the user and the source system.
Webapp first. API when needed.
Use the webapp for normal human visibility.
Use API or CLI readback when authorised PMT results need to feed a script, report, notebook, spreadsheet, custom dashboard or another application.
The API exposes stored result data under its query contract. Webapp state mapping, cadence judgement, stale handling and presentation rules belong to the operator-facing display unless a specific API endpoint says otherwise.
A visibility surface, not a control plane.
The webapp stays useful by remaining narrow.
If PMT disappears, the loss should be visibility — not control of the source system.
This is why the webapp can sit beside RMM, remote access, backup consoles, websites, applications, field equipment and analytical tools without needing to become any of them.
What the webapp does not do
- run remote commands
- patch or remediate systems
- discover devices or collect inventory
- inspect files or application logs
- diagnose root cause
- prove complete system health
- replace an RMM or observability platform
- provide a compliance archive
Start with one result worth seeing.
Send one selected result, open the webapp and see whether the view makes that operational fact easier to use.
Only add the next result when it earns its place.